|
|
|
|
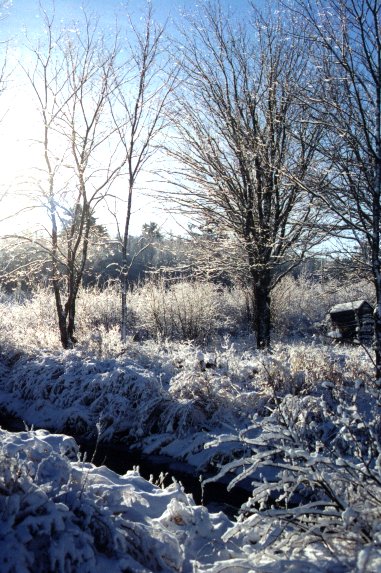
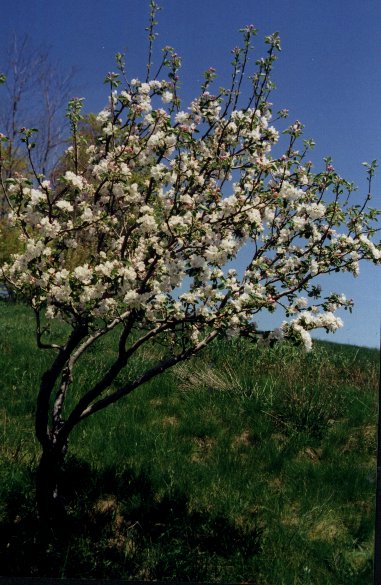
We think we’re pretty lucky in Bridgewater weather wise. Throughout the year we get a variety of temperatures, winds, precipitation and weather systems. Sometimes it seems likes the weather changes every ten minutes, but at least we never seem to get really wild weather like tornadoes or draughts or killer floods. Bridgewater is on the La Have River and is inland about 20 kilometers from the Atlantic Ocean. Our weather is affected by the sea, so we have a moderate climate. In the summer most days it never really gets too hot, and in the winter there are only a few days when it gets bitter cold. Each season is special in Bridgewater. In the summer we get more sun and hotter days then the rest of the year. It is usually between 20 and 30 degrees. We like to play road hockey and soccer, go swimming in lakes or at Risser’s beach , and go biking and camping. In the fall, it starts to get chillier and the leaves change colors because we get less daylight. Sometimes we get a lot of wind from the tail ends of hurricanes that come in from the eastern seaboard. We have fun racking and playing in the leaves. In the winter we sometimes have blizzards, but it doesn’t usually get colder than –50deggrees. We have quite a bit of snow this past winter that stayed from December to March. But normally our snow melts away after each storm. Our normal temperature stays close to 0deggrees. We often have school cancelled 7 or 8 days in the winter, but it’s usually because of icy roads, not deep snow. We like to get outside in the winter for snowball fights, snow boarding and coasting on the golf course hill and skiing at the MARC outside Bridgewater. In the spring, it can be really rainy with some warm days, then it gets cold again. We like skateboarding, skipping, climbing trees, and mowing the lawn. Bridgewater has a maritime climate, never getting too hot in the summer or two cold in the winter. Our temperature is controlled in many ways by the effects of the Atlantic ocean, Gulf Stream from the south and Labrador Current from the North. These give us cool breezes in the summer, warm spells in the winter and fog when the Gulf Stream and Labrador Current collide.
| Average Yearly Precipitation Since 1960 For Bridgewater
Horizontal axis are months of the year. Vertical axis represents millimeters of precipitation. (Graph made by Sasha) Average Yearly Temperature Since 1960 For Bridgewater
Horizontal axis are months of the year. Vertical axis represents millimeters of precipitation. (Graph made by Emily) Climate Data compliments of Environment Canada http://www.cmc.ec.gc.ca/climate/normals/NSB003.HTM
CNN Weather report for Bridgewater, Nova Scotia.
| |||||||||||||||||||||||||||||||||||||||||||||||||||||||||||||||||||||||||||||||||||||||||||||||||||||||||||||||||||||||||||||||||||||||||||||||||||||||||||||||||||||||||||||||||||||||||||||||||||||||||||||||||||||||||||||||||||||||||||||||||||||||||||||||||||||||||||||||||||||||||||||||||||||||||||||||||||||||||||||||||||||||||||||||||||||||||||||||||||||||||||||||||||||||||||||||||||||||||||||||||||||||||||||||||||||||||||||||||||||||||||||||||||||||||||||||||||||||||
|
Send mail to tonyeisn@ ontario.enoreo.on.ca with
questions or comments about this web site.
|